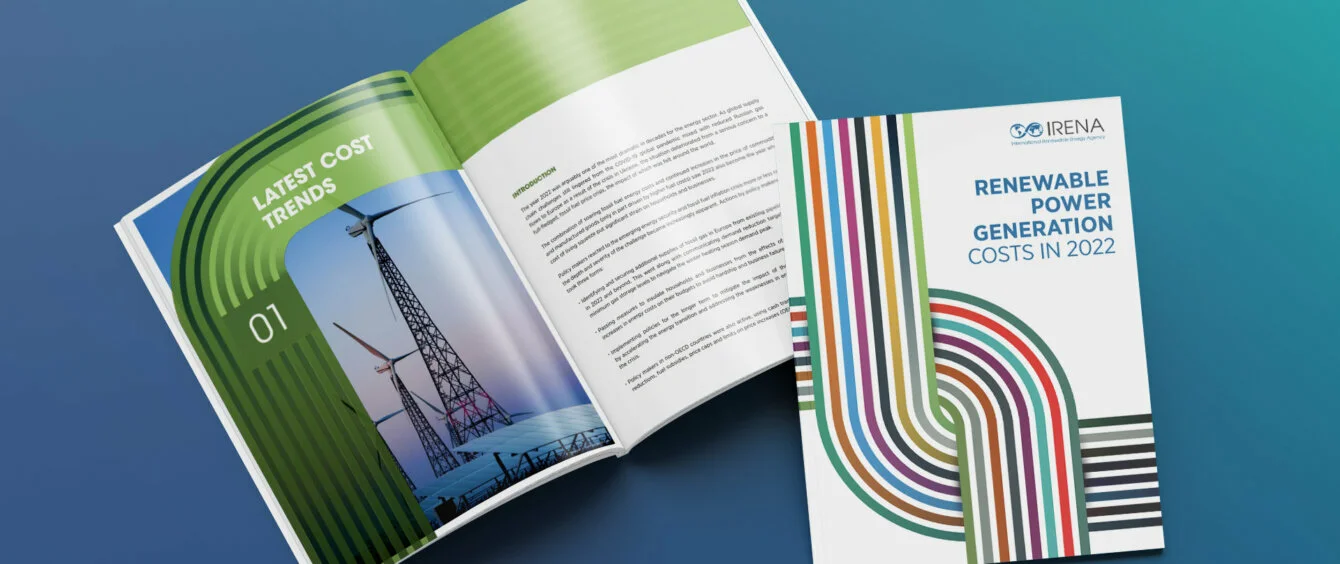
Rising costs had a variable impact on different energy sources last year, with location a key factor. However, the global weighted average Levelised Cost of Electricity (LCOE) from a raft of utility-scale renewable energy technologies — solar PV, onshore wind, Concentrated Solar Power, bioenergy and geothermal — all fell, according to the International Renewable Energy Agency’s recently-published report, Renewable Power Generation Costs in 2022.
Offshore wind costs rose, but only by 2%, a small increase, particularly when set against soaring fossil fuel prices.
Renewables’ competitiveness continues to increase
According to IRENA, the 2021-2022 period saw “one of the largest improvements in the competitiveness of renewable power in the last two decades.”
The low cost and security of domestically-generated renewable energy has become more and more pronounced.
The global-weighted average LCOE of onshore wind has dropped from being 95% more expensive in 2010 than the cheapest fossil fuel option to being 52% lower in 2022. Solar’s performance is even more spectacular: 710% more expensive than the cheapest fossil fuel option in 2010, 29% cheaper in 2022.
Compared with 2010, solar PV costs have dropped 89%, CSP and onshore wind by 68% and offshore wind by 59%. Bioenergy costs have fallen by 25%, while those of geothermal and hydropower have increased by 6% and 47% respectively. Despite the increase, hydro is still cheaper than the lowest cost fossil fuel option, IRENA says.
Avoided fuel costs run to billions
In particular, the agency highlights the enormous benefits of renewable energy in terms of security of supply. Solar and wind, for example, are not exposed to volatility in international fossil fuel markets, but provide electricity at a stable and predictable cost.
In 2022, IRENA estimates, renewable power deployed globally since 2000 saved an estimated $521 billion in fuel costs in the electricity sector alone.
For Europe, the figure was $176 billion. The agency says “it is possible that the build-out of renewables since 2020 saved the continent from a full-blown economic crisis.”
By technology, wind in 2022 saved the most in terms of avoided fuel costs at $224 billion — $189 billion for onshore and $35 billion for offshore — followed by hydro ($136 billion) and then solar ($88 billion).
China effect
The global data is heavily influenced by falling costs in China, which last year was the biggest market for both solar and onshore wind. This meant that the relative share of markets with higher installed costs within the global weighted average fell.
If China is excluded from the data, onshore wind costs were flat, for example – still impressive given the high level of inflation globally.
Similarly, a more granular look at solar PV shows that costs did rise substantially in some markets, for example France and Germany (+34%) and even more so in Greece (+51%).
For offshore wind, China’s share of new additions in 2022 was lower than in 2021 and rising costs were offset by technology improvements which saw the average capacity factor of offshore wind rise from 39% in 2021 to 42%.
Case for renewables is now compelling
Despite the geographical variations, technology improvements and economies of scale represent powerful forces reducing the impact of rising raw materials and labour costs on renewable energy projects.
As IRENA says: “after decades of falling costs and improving performance in solar and wind technologies, the economic benefits of renewable power generation – in addition to its environmental benefits – are now compelling.”
