The US power mix is changing fast. Over the last decade, coal-fired generation has been continually squeezed by growth in gas-fired generation on the one hand and, increasingly, by renewable energy on the other.
In fact, new renewable energy capacity additions now outstrip gas by some margin and coal plant continues to be permanently retired – another 11.6 GW will go this year, according to US Energy Information Administration (EIA), in all probability never to return.
Solar takes the lead
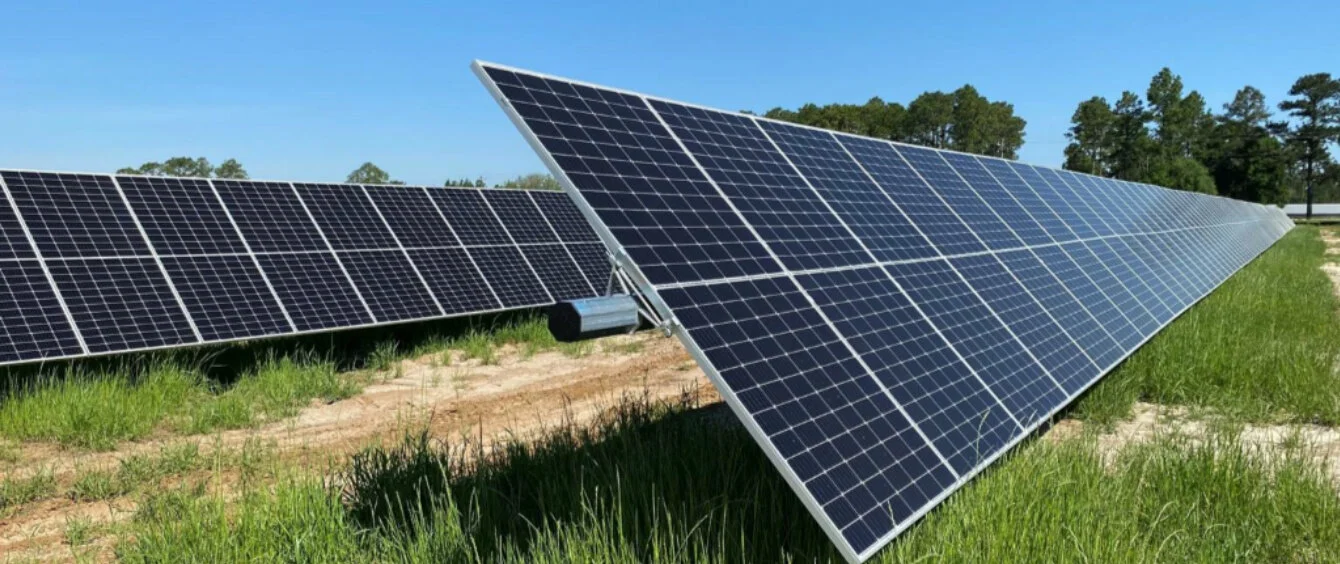
Solar generation was the fastest growing source of power in the US last year, jumping 25.3%. From 2006-2020, US solar generation rose from less than 1 TWh to 134 TWh.
Gas and renewables squeezing coal in the US generation mix
in terrawatt hours, Source: BP Statistical Review of World Energy, 2021The country installed 23.6 GW of new solar capacity in 2021, accounting for 46% of all generating capacity. This was the third year in a row that solar made up the largest share of new capacity, according to data from the Solar Energy Industries Association.
According to the EIA, the US will add 26.2 GW of new solar capacity this year, 21.8 GW of which will be utility-scale developments and the remainder residential. By comparison, wind capacity will rise by 7.6 GW.
Solar will become the US‘slargest power source
What power plant developers deploy today in large part determines how the US will generate electricity in the future and there is no question that the mix is getting greener.
However, the effects are already being seen. The EIA’s data suggests renewables’ share of electricity generation will this year overtake that of coal. Renewable energy generated 21.02% of US electricity in 2021, only marginally behind coal’s share of 21.6%.
Moreover, in its Annual Energy Outlook, the EIA forecasts that, by 2050, renewables will be generating 44% of US electricity. Solar, along with wind, will play the largest roles. Solar’s contribution to generation overtakes that of wind in the early 2030s and makes up 51% of all renewables installed by 2050, according to the forecast.
The EIA’s reference case is based on current laws and regulations, rather than new laws which could be introduced to speed up the energy transition.
Tax credit boost
The EIA’s Preliminary Monthly Electric Generator Inventory shows expected additions of 85 GW of new generation capacity this year and next, 51 GW of which will be solar and batteries. Of an expected 10 GW of battery storage more than 60% will be paired with solar generation.
The EIA identifies two primary drivers for the boom in solar plus storage; falling long-term technology costs, despite an increase last year, and the US government’s extension of the solar investment tax credit (ITC), which is proving a critical policy lever.
The solar ITC provides a 26% tax credit for residential and commercial solar developments. Under current policy, the credit will fall to 22% next year and then to 10% for commercial installations in 2024, when a zero rate for residential solar will come into effect.
This creates a major incentive to get solar installations started before the big fall in the ITC after December 31, 2023. Installations which commence construction prior to this date have until January 1, 2026 to start operating.
As a result, 45% of new generating capacity installed in the US in 2022 is forecast to be solar and 13% batteries. In 2023, solar’s share jumps to 52% with batteries at 12%. The remainder in both years is made up primarily of wind and gas-fired projects.
