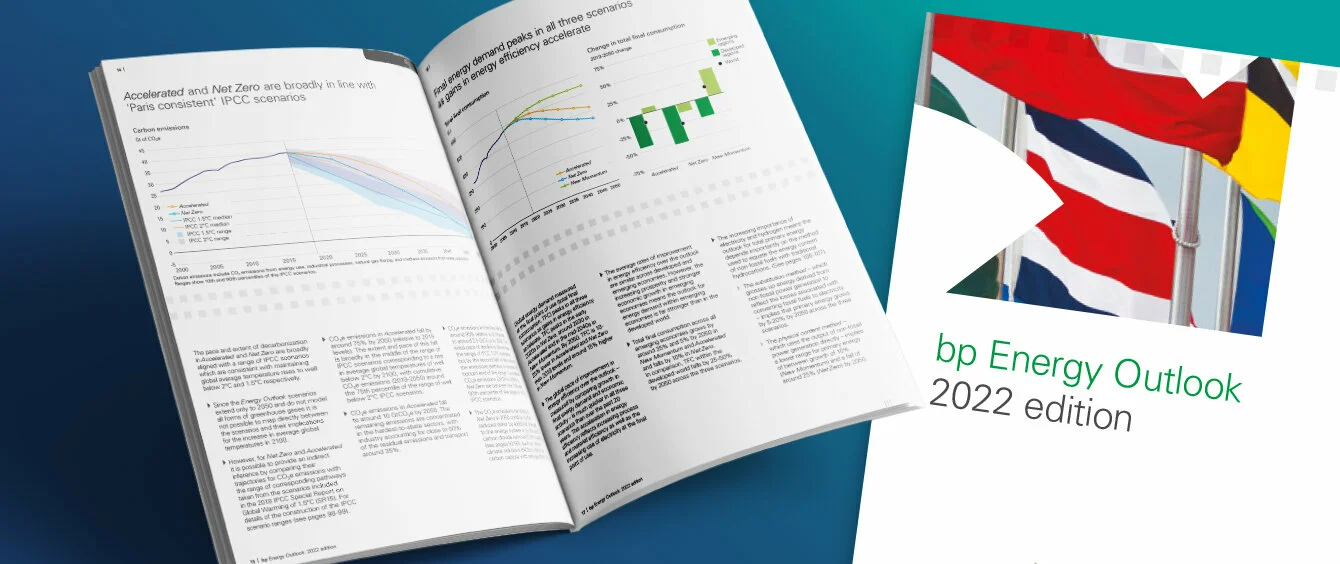
Spencer Dale, Chief economist of the multinational energy company, introduces a major caveat in the foreword to the new bp Energy Outlook: The scenarios were largely prepared before Russia began its war of aggression against Ukraine. Therefore, they do not consider the effects on economic growth or the world energy markets. As soon as the economic impact becomes visible, bp’s energy experts intend to update the scenarios.
This year’s edition of the report thus contains a provisional forecast. Nevertheless, the bp Energy Outlook serves as a point of reference for the potential energy system of the next 30 years. As in earlier versions, the company’s analysts developed several scenarios of the future of energy supply. This time around, the three main scenarios are Accelerated, Net Zero and New Momentum.
Three general trends
Based on these models, they describe how demand for primary energy and all energy sources could develop. In addition, they compute what this would mean for greenhouse gas emissions. Accelerated and Net Zero are consistent with the targets of the Paris Climate Agreement, which envisage limiting global warming to two or 1.5 degrees Celsius.
Bp’s experts outline three basic trends: The share of final energy consumption accounted for by fossil fuels would drop steadily through to 2050, with renewables registering a significant increase. Furthermore, electrification would increase, starting out slowly before gaining more and more steam. These trends are more or less pronounced from one scenario to the next.
Gradual shift in energy demand
declining role for hydrocarbons and rapid expansion in renewables expected, in per cent; source: BP p.l.c 2022This is clearly demonstrated by one example: in Net Zero, worldwide installed wind and solar capacity surges to over 6,500 gigawatts (GW) by 2030, quintupling relative to 2019. Conversely, in New Momentum, it totals about 3,300 GW, corresponding to a “mere” three-fold increase.
Wind and solar power grow rapidly
expected installations of wind and solar capacitiy, in gigawatts; source: BP p.l.c. 2022Demand for oil drops
The view taken on demand for crude oil by experts at bp, one of the world’s largest oil producers in its own right, is interesting. In two of the three scenarios, global demand would peak as early as 2025, before tapering off significantly. And even in New Momentum, the most cautious scenario, demand stagnates until 2030 before declining.
As usual, the current edition can be downloaded as a pdf file. The online version of the report is interactive and much more intuitive. Using a series of charts, it illustrates beautifully the evolution and change in the structure of energy demand. For example, it provides deeper insight into oil, gas, renewables and hydrogen as energy fuels.
